


PAM, TAM, SAM, SOM — a method for assessing market size, popular in startups and growing businesses. The method is used to understand growth prospects and whether it is worth investing money in a project. Often, calculations using this method are presented to an investor before discussing investments in a startup.
The second important application is assessing market size for yourself. Very often you can see how novice entrepreneurs have calculated a market size of 10 million and are very happy, considering it large. These may be large numbers for a person, but not for a business. When we break it down into components, it turns out that it is small and the idea is not worth implementing. For example, if the market is 10 million and we capture it completely (which never happens), then we get a turnover of 10 million, not profit. Subtract taxes (individual entrepreneur simplified tax system) 6%, 9.4 million left, 40% of the total amount is production cost. 5.4 left. Now divide by 12 months in a year – 450 thousand rubles. We need to pay for – office (50 thousand), accountant (10 thousand), advertising (150 thousand), website maintenance (15 thousand). In total, we have 225 thousand per month for 4 founders, i.e. 56 thousand rubles each. And if there are unforeseen expenses, and there will be, then even less. And this is without money for development, new products, etc. It is more profitable to go work for hire and earn more without risk. Therefore, the volume of small markets needs to be assessed very accurately to understand whether it is worth pursuing them at all.
In the planner, we do not use PAM, as it is too global, but in theory it will be useful to read and learn about it.
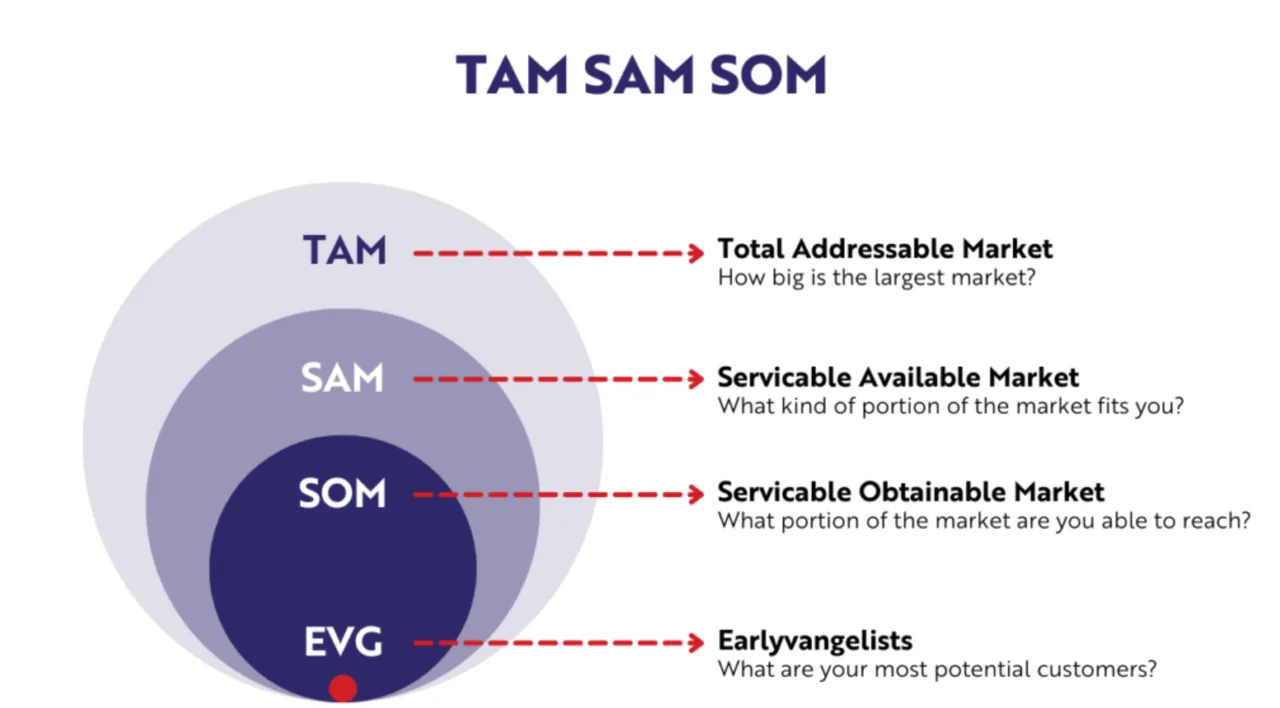
PAM, TAM, SAM and SOM — these are indicators. Each of them corresponds to a market segment. The segments are nested within each other. The largest is PAM, followed in order by TAM, SAM, SOM. Thus, SOM is included in SAM and all preceding segments, and TAM includes SAM and SOM. Below we will break down what each indicator means.
We will study the methodology using the example of an online service — an educational platform for schools and universities. The platform has a website, but 90% of its materials are available only by subscription. On the platform, leading industry experts publish educational materials, recommendations, and reviews of innovations in educational standards.
The sales system is very simple. Sales managers call educational institutions and offer teachers and administrators to try several courses for free, and then convince them to subscribe to the platform. The subscription must be paid once a year.
The target market is schools and universities. 95% of subscriptions are paid by educational institutions for their teachers. One institution takes out one subscription — no more is needed.
PAM
PAM (Potential Available Market) — potentially available market. This is the entire market volume taking into account how it will change during the planning period. We do not use it in the planner, as it is too global, and generally it is more like a fantasy than a calculation.
In the example. There are 5,000 educational institutions in the country, including schools and universities. According to forecasts from the research company IDC, the number of educational institutions will increase by 15% over the next three years — to 5,750. The cost of a subscription to the educational platform is 20,000 rubles per year. PAM will be 5,750 × 20,000 rubles — about 115 million rubles.
What it shows. The global market volume and its trends. Markets can grow or shrink, change significantly. The indicator takes into account the global picture, and it is the most large-scale of all 4. For markets that change slowly, the PAM indicator will be as close as possible to TAM. But if a startup operates in an innovative industry that grows by 100% per year, the PAM estimate for several years ahead will be interesting. Investors usually do not look much at this indicator.
TAM
TAM (Total Addressable Market) — total market volume where your product can be sold. The indicator includes all potential customers — including those who already buy from your competitors or do not even buy similar products.
In the example. There are 5,000 educational institutions in the country. A subscription to the educational platform costs 20,000 rubles, which means TAM will be about 100 million rubles.
What it shows. TAM is the growth limit of the company. The indicator demonstrates the prospects of the product if it can capture the entire market. In practice, TAM is unattainable, and even 10% of TAM is a big victory. Figures close to 100% of TAM occur in monopolized markets.
TAM is also used to determine whether a company has potential for expansion in the market.
SAM
SAM (Served/Serviceable Available Market) — available market volume, a share of TAM. SAM shows how much money is already being spent on solutions similar to yours. SAM is the market of direct competitors and analogues.
For single strollers, SAM is the sales volume of single strollers; for a legal reference system, SAM is the sales volume of reference systems for lawyers.
In the example. There are 5,000 educational institutions in the country that could purchase a subscription to the educational platform. However, only 40% of such institutions are interested in using online platforms for learning. You know this from analytics data or from your own call results. SAM will be 2,000 × 20,000 rubles — about 40 million rubles.
What it shows. The market volume that can be captured if direct competitors are displaced. This is the maximum volume of the niche in which the company operates. SAM does not take into account those who could buy the product but do not buy it for various reasons.
SOM
SOM (Serviceable & Obtainable Market) — realistically achievable market volume, a share of SAM. This is the sales volume that a company can obtain using the tools available to it.
In the example. Almost all sales of our educational platform come through direct calls to customers. 60% of educational institutions are not interested in purchasing educational platforms. If a manager reaches an institution that belongs to the remaining 40%, the conversion rate will be 20%. One out of five interested educational institutions buys our platform. SOM will be 2,000 × 20% × 20,000 rubles — about 8 million rubles.
What it shows. What market volume can be obtained using the existing strategy. SOM excludes customers who potentially exist in the market but the company cannot reach them. The indicator takes into account competition, sales conversion in the company, and other factors.
“Top-down” or “bottom-up” — how to assess market volumes
There are two ways to assess PAM, TAM, SAM and SOM: “top-down” and “bottom-up”.
“Top-down”. In this approach, available analytical data about the market as a whole is taken, and then parts that do not relate to the lower indicator are “cut off”. It is important to:
- use reliable and up-to-date sources of information;
- understand how to segment the market if there are no direct studies to calculate the metric. For example, if you do not know what share of all market participants buy analogues of your product.
How to calculate market volume “top-down” for an educational online platform:
- Multiply the number of educational institutions by the subscription cost — this is TAM.
- Assume that only 40% of institutions are ready to buy an educational platform. Multiply TAM by 40% — get SAM.
- In the market, besides ours, there are three similar platforms — meaning we can get 25% of the market. Multiply SAM by 25% — get SOM.
“Bottom-up”. The method is used when hypotheses have already been tested and the company has data on the sales funnel. The marketer knows the conversion rate, sales costs, and other necessary indicators.
The calculation of metrics starts from already known project indicators. First, SOM is calculated, then they move to SAM, TAM, and PAM. Usually, the “bottom-up” method gives smaller numbers than the “top-down” method.
How to assess the market for an accounting online magazine using the “bottom-up” method:
- There are 8,000 clinics in the market. Every hundredth clinic that our managers call buys a subscription to the magazine. Thus, if we call all clinics, we can get 80 clients. Multiply this number by the subscription price — 32,000 rubles per year — and get 2.56 million rubles. This is our SOM.
- From calls, we know that 30% of all clinics buy subscriptions to magazines for accountants. It turns out that in our SAM market there are 2,400 clinics, or 76.8 million rubles per year. This is the maximum market we will get if we displace competitors.
- In total, there are 8,000 medical organizations in the market. Multiply this number by the subscription price of the magazine and get TAM — 256 million rubles. We will be able to enter the TAM market if we learn to sell magazines to clinics that currently do not buy them under any conditions.
- Every year, the number of private medical organizations in the country grows by 10%. In three years, the PAM market will have about 10.6 thousand organizations and almost 340 million rubles.
The formulas for calculating SOM, SAM, TAM and PAM will depend on what data is available to the company. In some places, instead of numbers from studies, there may be hypotheses. Our example only shows the principles of the methodology. It does not take into account, for example, that the magazine could be sold at a higher or lower price, which would affect the market assessment.
Key Points
- PAM, TAM, SAM, SOM — a methodology for assessing market volumes for a product or service. These are four metrics: PAM — potential market volume, TAM — total market volume, SAM — available market volume, SOM — realistically achievable market volume.
- There are two ways to calculate the metrics: “top-down” and “bottom-up”. In the “top-down” method, analytical data is used, and the calculation starts from the total market volume — TAM. In the “bottom-up” approach, known indicators of your project are used, and the calculation starts from the realistically achievable market volume — SOM. It is better to calculate both ways. The results will likely differ, but this will help understand the real situation.
- When you get six metrics, compare the results in pairs and determine the reasons for discrepancies.
- The PAM, TAM, SAM, SOM methodology does not provide exact values of market volume. It only shows hypothetical values that help understand the prospects of the project.
Task
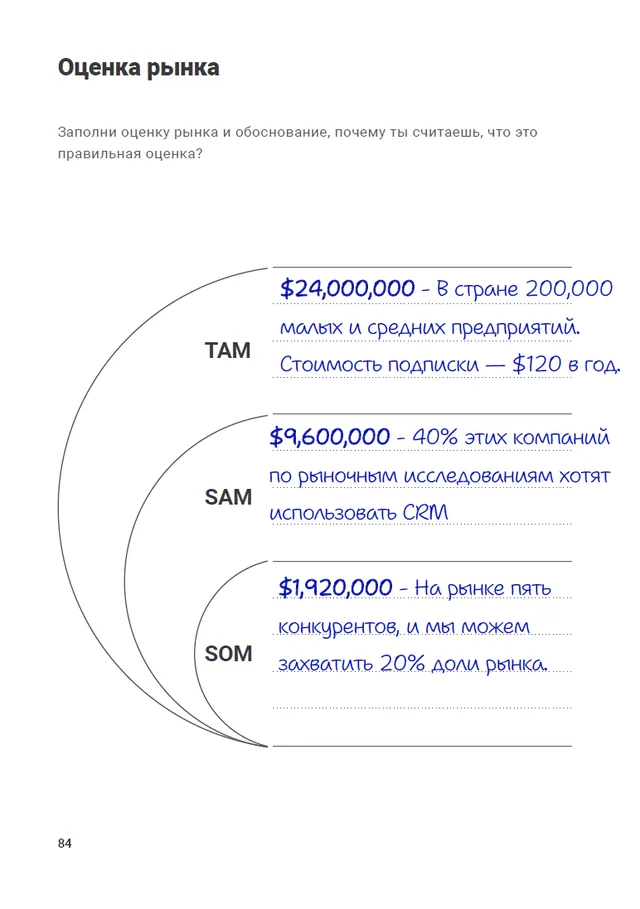
Conduct research and fill in page 84 of the planner, indicate the exact figure and a brief justification. There is intentionally not much space here, you do not need to describe all the math of calculations and depth of research. Formulate very briefly, but so that it is clear. Calculations are also important, record them on pages 97 – 107 of the notes.
Example of filling
FAQ
Why does the “bottom-up” method often give smaller numbers than the “top-down” method?
The “bottom-up” method is based on real sales and conversion data, which gives a more accurate estimate of the achievable market (SOM), while the “top-down” method uses general market data, which may be less realistic.
How to determine the conversion rate for calculating SOM?
The conversion rate can be determined based on current sales data, hypothesis testing, and sales funnel analysis. For example, out of 100 calls, 10 lead to a sale, giving a conversion rate of 10%.
In which cases is it better to use the “top-down” method for market assessment?
The “top-down” method is best used in the early stages, when there is not enough sales data, and it is necessary to estimate the overall market size based on available analytical data and research.
Comments
0No comments yet.
Sign in to join the discussion.