


How the HADI cycle works
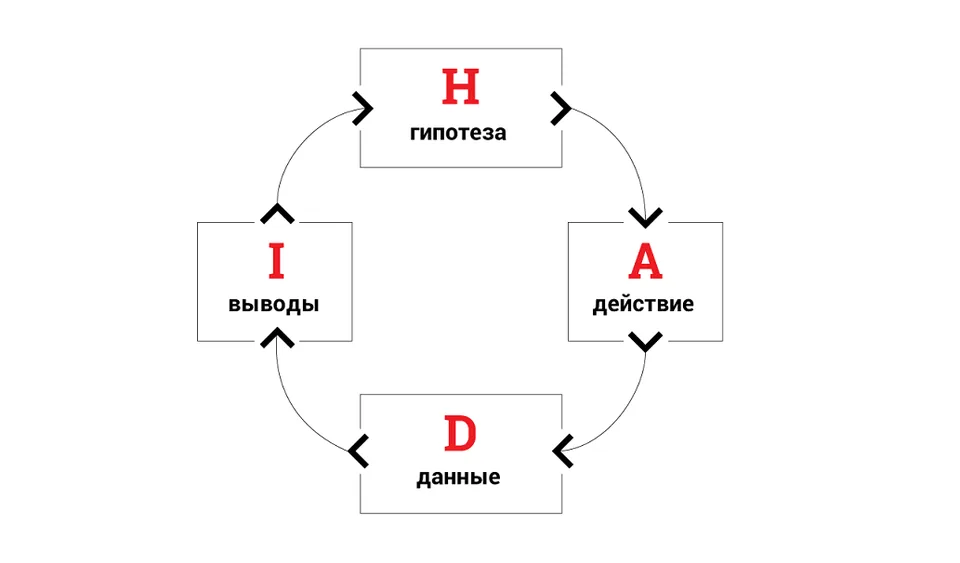
HADI is a research method consisting of four stages: formulating a hypothesis (H), action (A), data collection (D), and insights (I). Thus, it is an acronym where each letter corresponds to one stage of the cycle.
The cycle is assumed to be infinite. That is, after the company has drawn conclusions, it formulates a new hypothesis. This allows for continuous development of the business or project.
This method is great for testing hypotheses; it allows you to formulate a hypothesis in such a way that the list of actions to test it becomes obvious.
We will break down each stage.
H — hypothesis. At this stage, a hypothesis is formed. Simultaneously with the hypothesis, indicators that the change should affect are selected. Thus, you need to describe what is planned to be changed, which metrics, and how it will affect them.
It is important that only one hypothesis should be tested per cycle. Otherwise, it will not be clear what influenced the metric. If you need to test several hypotheses at once, they should relate to different metrics.
For example: "We want to add another "order" button on the landing page; this should increase the conversion rate of the landing page."
A — action. This is the stage during which the changes are implemented. In the landing page example, A is the stage when additional buttons are installed on the landing page.
D — data collection. At the third stage, data is collected that confirms or refutes the hypothesis. First of all, data is collected on the metric that was targeted.
In our example, that metric is conversion to lead. You need to collect data on conversion for the period when the additional "Order" button was on the site, as well as data for previous periods. This way, you can understand whether the change affected conversion.
I — insights. At the last stage, you need to analyze whether the hypothesis worked. If yes, the change can be kept or scaled. If not, you need to test another hypothesis.
In the landing page example, if conversion increased after adding the button, the button is kept. Now you can test other changes that should increase conversion.
Tips: how to test hypotheses using the HADI method
To make hypothesis testing with HADI effective, it is important to organize the work correctly:
- Formulate several hypotheses for one metric. Analyze each to choose the most useful one. It should be tested first.
- Formulate the hypothesis as a question so that it can be answered unequivocally "yes" or "no".
- Find out if the team believes in the hypothesis. If not, it probably isn't worth testing.
- Assess how difficult it is to test the hypothesis. If it is difficult and the team hardly believes in it, it is better to postpone it.
- Start testing the hypothesis as soon as possible and stop as soon as you get the necessary information.
- Data must be statistically significant. For example, if you are testing a website, enough users should visit it during the study. The minimum statistically significant number is considered to be 30. So, if you want to test a change on a landing page, you need to get at least 30 leads.
- A week is the optimal time to test a simple hypothesis. This time is usually sufficient.
A few examples of research using the HADI model
HADI cycles are most often used in internet marketing to test email campaigns, SEO, contextual and targeted advertising. Let's look at a few simple examples.
Contextual advertising for an online pet store. Hypothesis: if you pay not for clicks on ads in contextual advertising, but for leads, the cost per conversion will decrease.
Action: change the advertising strategy from paying per click to paying per conversion.
Data collection: leads from advertising turned out to be too expensive. The cost per conversion increased by 1.5 times.
Insights: the hypothesis is incorrect. Need to revert to the pay-per-click scheme.
Advertising for wooden stairs. Hypothesis: if the ad states that measurements are free, the number of clicks to the site will increase.
Action: add information about free measurement for staircase production to the ad.
Data collection: ad click-through rate increased from 4% to 9%.
Insights: the hypothesis is correct. Need to add information about free measurement to all ads.
Website of a pastry chef. Hypothesis: if you add information about the composition of cakes and photos to the site, the number of orders will increase.
Action: take photos of cakes, describe their composition, and publish them on the site.
Data collection: the number of orders by phone doubled, online orders increased by 1.5 times.
Insights: the hypothesis is correct. Probably worth adding even more product information and regularly updating photos.
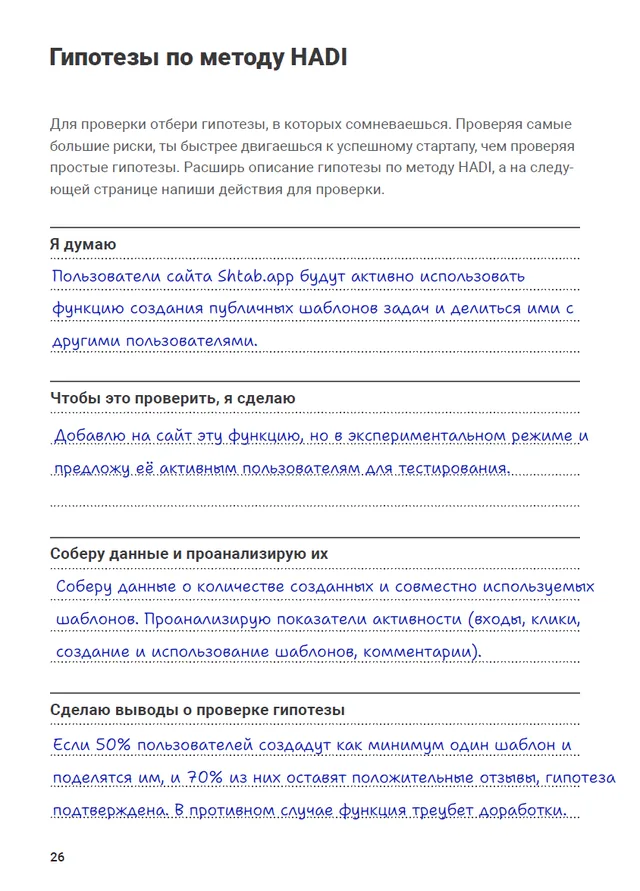
Example of filling out
Comments
0No comments yet.
Sign in to join the discussion.