
1 action = x10 to perception speed 😎
A study on the decline in investment in science in Russia has been published.
2025-2026 is a tough year for public sector funding, this decline was expected.
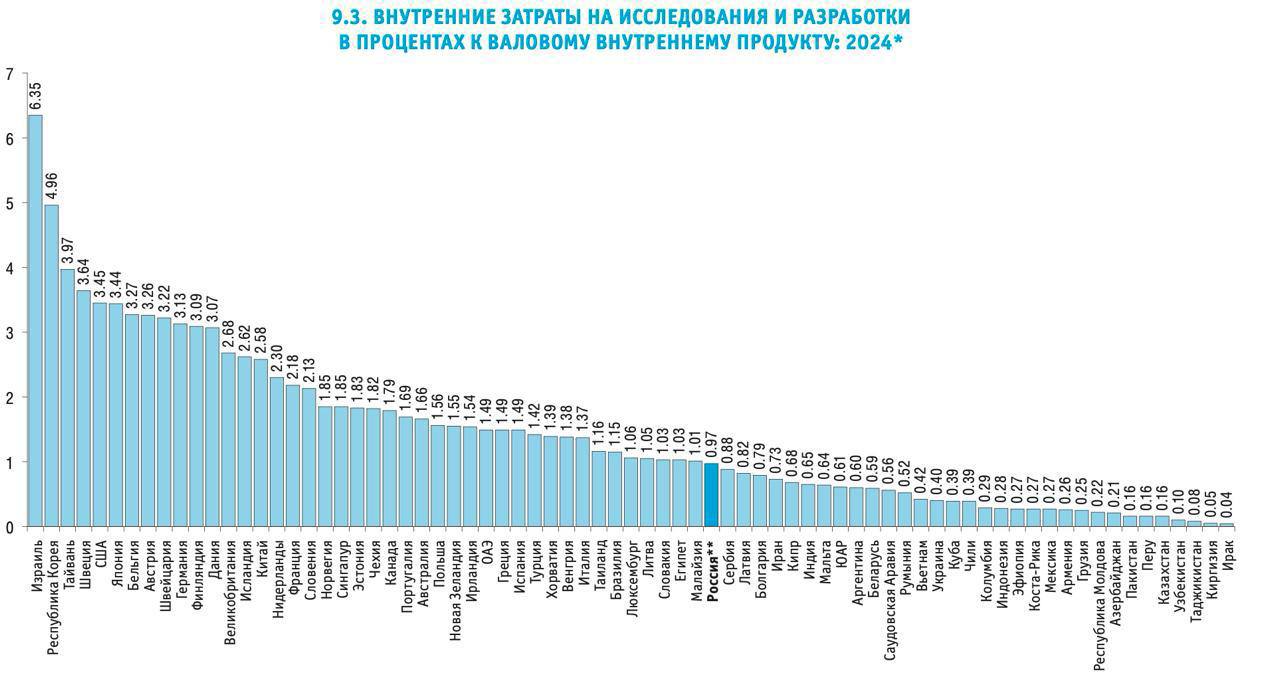
But my eye caught the charts in the last section of the document.
And for some reason, this particular chart is shown as a preview.
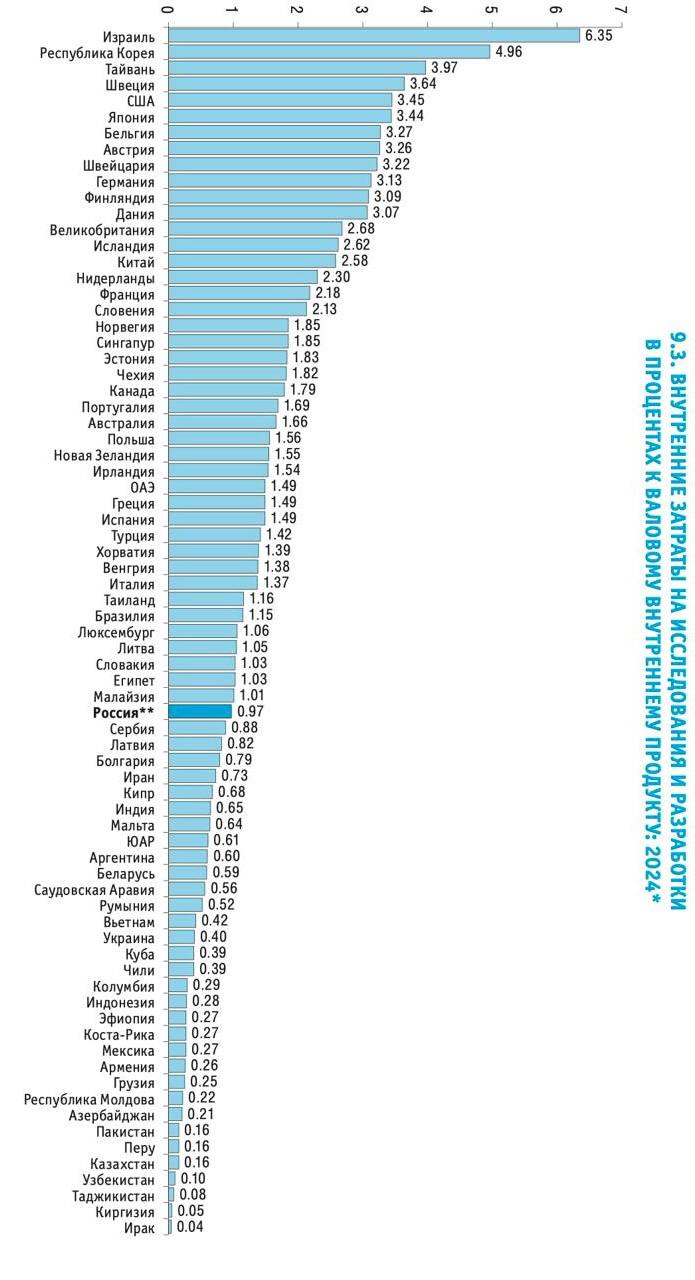
A good anti-example of how not to make charts and captions. Otherwise, a pinched neck is guaranteed 😂
And it can be fixed, just by turning along the line of sight, and the chart immediately becomes clear 🔥
Which version of the chart is easier to read?
👀 - Option 1 is great if you look while reclining
🔥 - Option 2, no matter how you look
@data_dzen 🙂
Comments
0No comments yet.
Sign in to join the discussion.