
📊 Data-Driven Management: How to Make Decisions Based on Data, Not Intuition
Stop managing by gut feeling. In 2026, a data-driven approach is not a competitive advantage—it's a basic survival standard. According to McKinsey, companies that make decisions based on data are 23 times more likely to acquire customers and 19% more profitable than competitors. Let's break down how to implement this right now.
Step 1. Abandon "fragmented reporting"—move to a unified metrics system
Typical pain: the project manager uses Excel, the development team uses Jira, finance uses 1C, sales uses CRM. No one sees the big picture in real time.
What to do instead: build a unified information field through integrations. A real example is the company "CDS," which integrated ITSM 365 with the ERP system AXAPTA: data on new assets, equipment issuance, and acts are transferred automatically, without manual duplication. Another example is ITSM 365 + Power BI + CRM: management sees a consolidated report on sales and service in one dashboard, instead of spending time assembling common tables.
Basic integration stack for PM:
- Jira / Redmine / Kaiten → task and sprint management
- CRM (amoCRM, Bitrix24, ELMA) → client project status and payments
- ERP / 1C → budgets, resources, closing documents
- ITSM → incidents and user requests
- BI layer (Apache Superset, Power BI) → unified dashboard on top of everything
Step 2. Define 5–7 key metrics—no more
One of the main mistakes is tracking 30 metrics and not making a single decision. An effective dashboard is built on 5–10 high-signal KPIs.
For each metric—owner, target threshold, and escalation trigger. Without this, the dashboard remains a pretty picture.
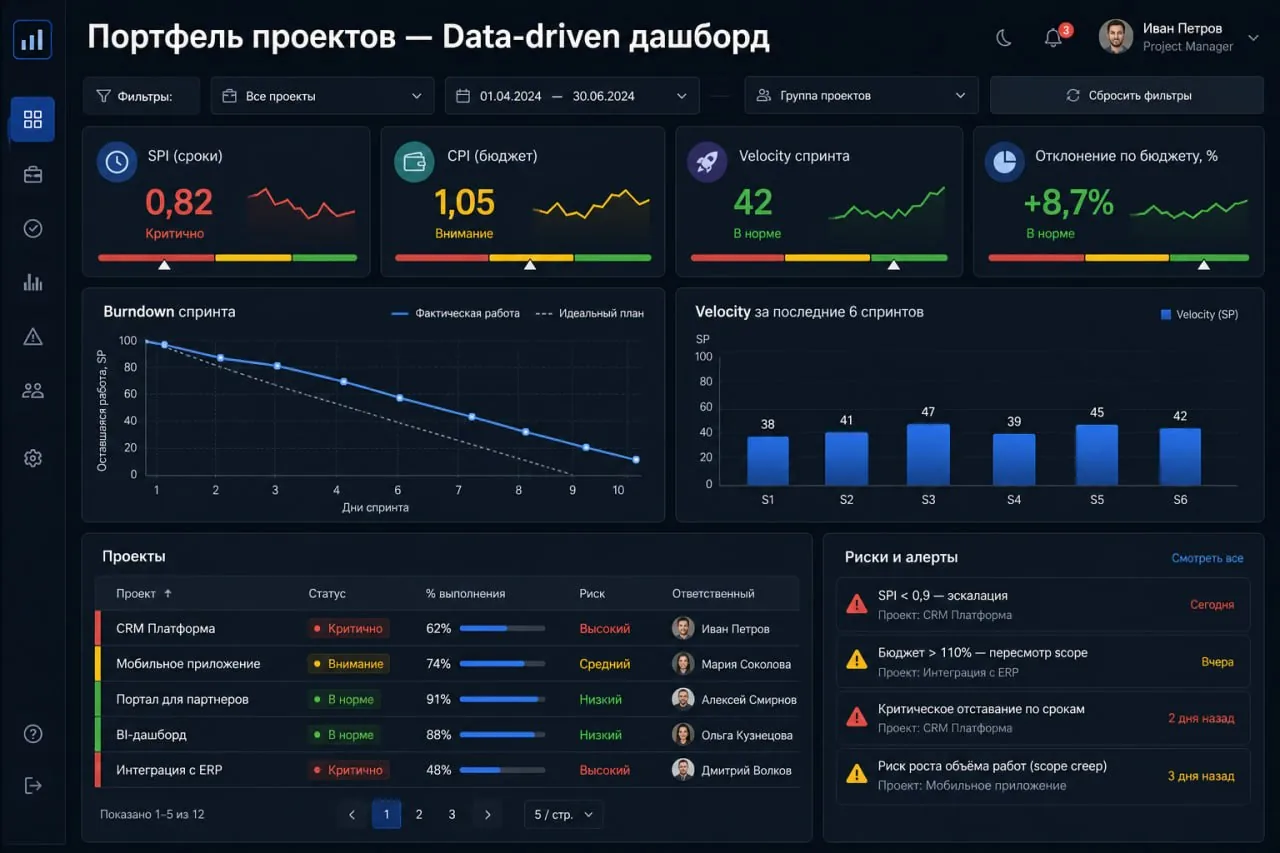
Step 3. Build a PM dashboard—a 15-minute daily structure
Goal: in 15 minutes each morning, see the status of all active projects and make decisions, not "collect data."
Recommended dashboard structure (tested in practice):
🔴 Row 1 — "Red Flags": KPI tiles with RAG status (red/yellow/green). Immediately see where the problem is.
→ Budget deviation, SPI, open blockers
🟡 Row 2 — "Progress": Sprint burndown chart, velocity over the last 5 sprints, percentage of milestones completed.
→ Tools: Grafana
🔵 Row 3 — "Resources and Risks": Team load by role, top 3 risks with probability and owner.
→ Strive/Kaiten/Shtab
🟢 Row 4 — "Client": CSAT (norm >80%), NPS (norm >50), payment status from CRM/ERP.
Real case: a construction company with a portfolio of 200+ projects implemented predictive analytics—forecast accuracy for deadlines increased from 45% to 78%, and reporting preparation time decreased by 65%.
Step 4. Automate alerts—the dashboard should "scream," not stay silent
A dashboard without alerts is a rearview mirror. Configure:
- Threshold alerts in Max/Telegram/...: when SPI drops below 0.9—automatic notification to the project owner
- Auto-creation of tickets: when budget deviation is critical → task in Kaiten with deadline and context
- Weekly digest: automatic mailing with wins, risks, and recommended actions
Example from practice: OpenTask integrated ITSM 365 with 1C—invoicing to contractors reduced from 2 days to 10 minutes.
Step 5. Move from descriptive to predictive analytics
Most teams get stuck at the "what happened" level. Data-driven management has four levels:
- Descriptive → "What happened?" (basic reports)
- Diagnostic → "Why?" (root cause analysis)
- Predictive → "What will happen?" (forecast with 70–85% accuracy)
- Prescriptive → "What to do?" (AI suggests specific steps)
Tools to start without a big budget:
🔧 Apache Superset (open-source) — free BI with real-time dashboards, connects to PostgreSQL, ClickHouse, Oracle
📊 Power BI — integration with Azure DevOps, Project, Excel, predictive analytics with built-in AI
🚀 Kaiten — built-in Agile analytics without a separate BI layer
Comments
0No comments yet.
Sign in to join the discussion.