
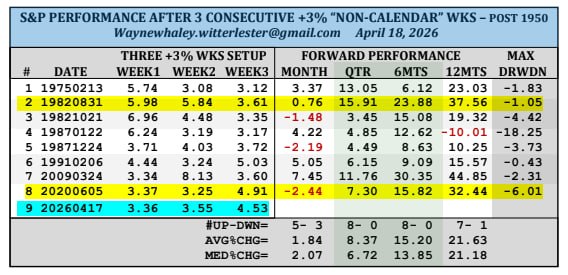
The S&P 500 closed three consecutive weeks with gains over 3%: +3.36%, +3.55%, and +4.53%. Since 1950, this has happened only twice, in 1982 and 2020 (highlighted in yellow).
The classic bullish interpretation relies precisely on these cases - 12 months later, the market was up over 30%. But a sample of two observations seems insufficient for making decisions with real risk.
An extended analysis using rolling 15-day periods (i.e., series of 5+5+5 days no longer need to start on Monday and end on Friday) yields 8 similar cases.
The picture becomes more robust:
- After 3 months, the market rose in 100% of cases, with an average gain of +8.37%;
- After 6 months, also 100% positive outcomes, with an average gain of +15.2%.
The only "spoiled" case is 1987. A strong bullish trend ended in disaster amid a spike in rates and the crash on Black Monday, October 19, 1987. A telling example of how an external shock can break even a perfect momentum. Today, such a shock could come at any moment from the US President.
There is no certainty on the stock exchange, only probabilities.
Comentarios
0Aún no hay comentarios.
Inicia sesión para participar en la conversación.