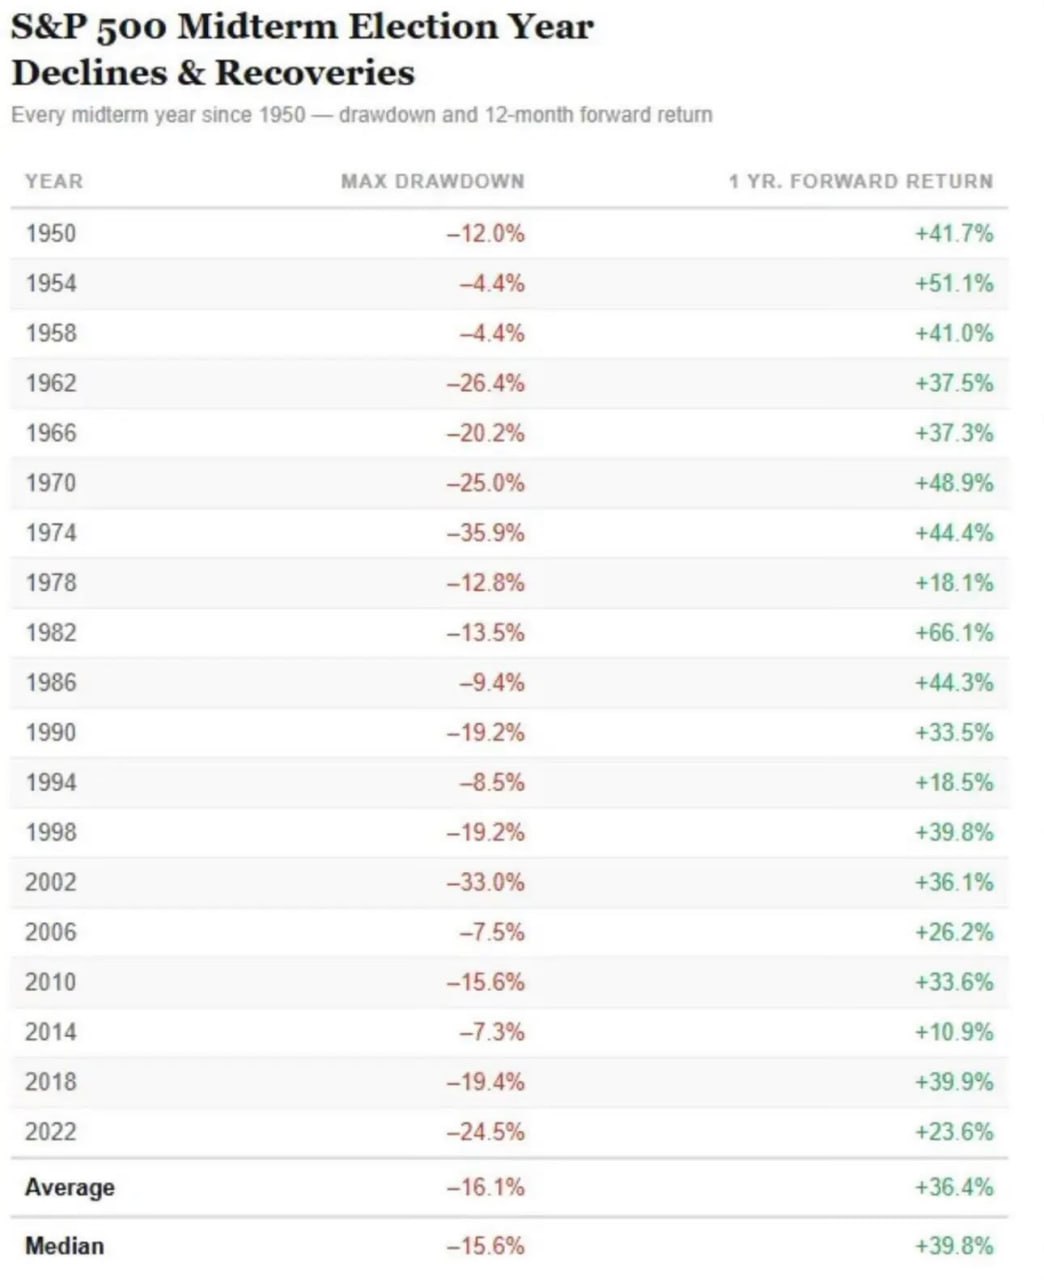
The table shows the behavior of the S&P 500 during US midterm election years since 1950.
If the 9.8% decline in the S&P 500 that we just experienced turns out to be the maximum for the year, it would be the seventh largest decline in midterm election years since 1950. And it would be significantly less than the historical average of -16.1%.
In this case, it is interesting to look at the strength of the rebound after capitulation - the 12-month return from the lowest point of the decline is shown in the right column of the table.
Comments
0No comments yet.